


Shift your car buying experience
See how your top choices measure up on the features that matter most to you.


Reliability
Predicted Reliability
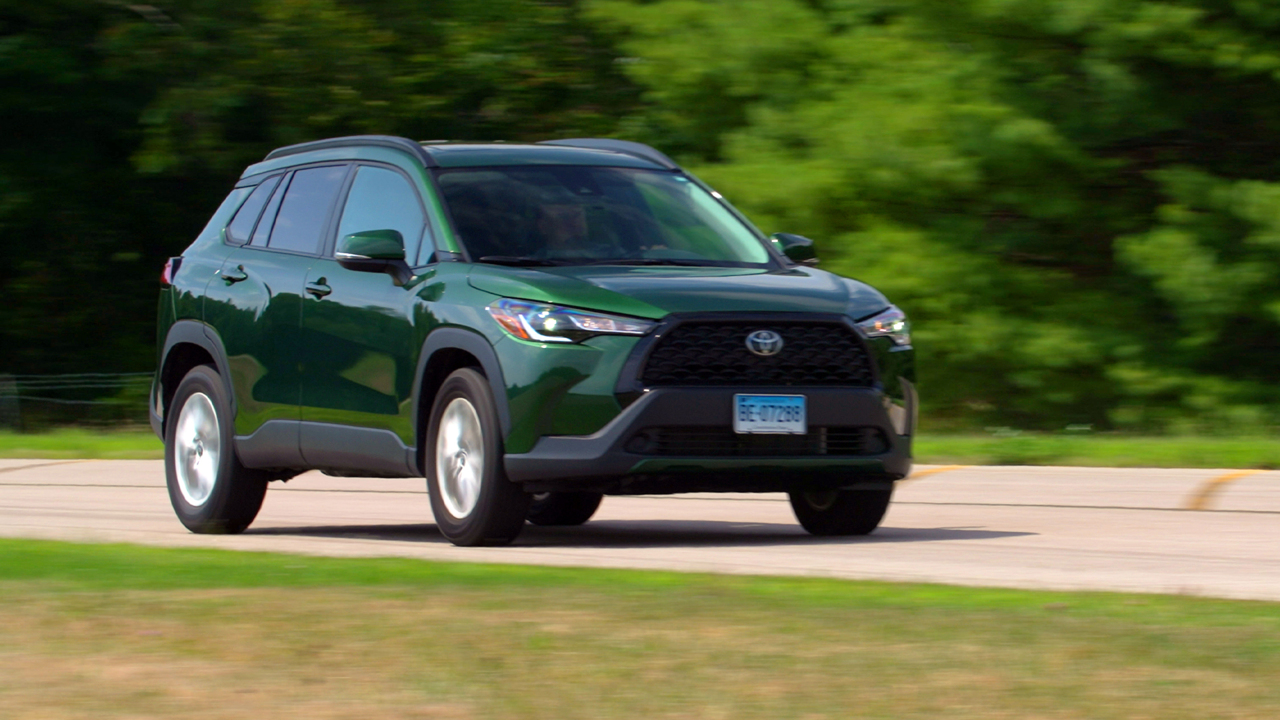
We expect the 2025 Corolla Cross will be more reliable than the average new car. This prediction is based on data from 2022, 2023, and 2024 models, and the Toyota brand score.
New Models Predicted Reliability
This Car
0
100
0 - 100
Toyota Corolla Cr...
Toyota Corolla Cross
vs. Similar Cars
Buick Encore GX
Buick Encore GX
Chevrolet TrailBl...
Chevrolet TrailBlazer
Ford Bronco Sport
Ford Bronco Sport
Honda HR-V
Honda HR-V
Hyundai Kona
Hyundai Kona
Kia Seltos
Kia Seltos
Mazda CX-30
Mazda CX-30
Mitsubishi Eclips...
Mitsubishi Eclipse Cross
Mitsubishi Outlan...
Mitsubishi Outlander Sport
Nissan Kicks
Nissan Kicks
Subaru Crosstrek
Subaru Crosstrek
Toyota Corolla Cr...
Toyota Corolla Cross Hybrid
Volkswagen Taos
Volkswagen Taos
Toyota vs. Other New Car Brands Reliability
Reliability History
*
Redesign year
Overall Reliability Verdict
POTENTIAL TROUBLE SPOTS
Overall Reliability Verdict
Potential Trouble Spots
2000
2001
2002
2003
2004
2005
2006
2007
2008
2009
2010
2011
2012
2013
2014
2015
2016
2017
2018
2019
2020
2021
2022*
2023
2024
Powertrain
2000
2001
2002
2003
2004
2005
2006
2007
2008
2009
2010
2011
2012
2013
2014
2015
2016
2017
2018
2019
2020
2021
2022*
2023
2024
Engine Major
2000
2001
2002
2003
2004
2005
2006
2007
2008
2009
2010
2011
2012
2013
2014
2015
2016
2017
2018
2019
2020
2021
2022*
2023
2024
Engine Minor
2000
2001
2002
2003
2004
2005
2006
2007
2008
2009
2010
2011
2012
2013
2014
2015
2016
2017
2018
2019
2020
2021
2022*
2023
2024
Engine Cooling
2000
2001
2002
2003
2004
2005
2006
2007
2008
2009
2010
2011
2012
2013
2014
2015
2016
2017
2018
2019
2020
2021
2022*
2023
2024
Engine Electrical
2000
2001
2002
2003
2004
2005
2006
2007
2008
2009
2010
2011
2012
2013
2014
2015
2016
2017
2018
2019
2020
2021
2022*
2023
2024
Transmission Major
2000
2001
2002
2003
2004
2005
2006
2007
2008
2009
2010
2011
2012
2013
2014
2015
2016
2017
2018
2019
2020
2021
2022*
2023
2024
Transmission Minor
2000
2001
2002
2003
2004
2005
2006
2007
2008
2009
2010
2011
2012
2013
2014
2015
2016
2017
2018
2019
2020
2021
2022*
2023
2024
Drive System
2000
2001
2002
2003
2004
2005
2006
2007
2008
2009
2010
2011
2012
2013
2014
2015
2016
2017
2018
2019
2020
2021
2022*
2023
2024
Fuel System/Emissions
2000
2001
2002
2003
2004
2005
2006
2007
2008
2009
2010
2011
2012
2013
2014
2015
2016
2017
2018
2019
2020
2021
2022*
2023
2024
Exhaust
2000
2001
2002
2003
2004
2005
2006
2007
2008
2009
2010
2011
2012
2013
2014
2015
2016
2017
2018
2019
2020
2021
2022*
2023
2024
Show all Powertrain Trouble Spots
Suspension/Steering
2000
2001
2002
2003
2004
2005
2006
2007
2008
2009
2010
2011
2012
2013
2014
2015
2016
2017
2018
2019
2020
2021
2022*
2023
2024
Brakes
2000
2001
2002
2003
2004
2005
2006
2007
2008
2009
2010
2011
2012
2013
2014
2015
2016
2017
2018
2019
2020
2021
2022*
2023
2024
Climate System
2000
2001
2002
2003
2004
2005
2006
2007
2008
2009
2010
2011
2012
2013
2014
2015
2016
2017
2018
2019
2020
2021
2022*
2023
2024
Build Quality
2000
2001
2002
2003
2004
2005
2006
2007
2008
2009
2010
2011
2012
2013
2014
2015
2016
2017
2018
2019
2020
2021
2022*
2023
2024
Electrical Accessories
2000
2001
2002
2003
2004
2005
2006
2007
2008
2009
2010
2011
2012
2013
2014
2015
2016
2017
2018
2019
2020
2021
2022*
2023
2024
Body Hardware
2000
2001
2002
2003
2004
2005
2006
2007
2008
2009
2010
2011
2012
2013
2014
2015
2016
2017
2018
2019
2020
2021
2022*
2023
2024
Paint/Trim
2000
2001
2002
2003
2004
2005
2006
2007
2008
2009
2010
2011
2012
2013
2014
2015
2016
2017
2018
2019
2020
2021
2022*
2023
2024
Noises/Leaks
2000
2001
2002
2003
2004
2005
2006
2007
2008
2009
2010
2011
2012
2013
2014
2015
2016
2017
2018
2019
2020
2021
2022*
2023
2024
Show all Build Quality Trouble Spots
In-car Electronics
2000
2001
2002
2003
2004
2005
2006
2007
2008
2009
2010
2011
2012
2013
2014
2015
2016
2017
2018
2019
2020
2021
2022*
2023
2024
Reliability indicates how models have performed in the past, providing the basis for predicting
how the vehicles will hold up in the year ahead. These charts provide the most comprehensive
reliability information available to consumers. Based on information received from our latest
subscriber survey for over 300,000 vehicles, our reliability history charts give
you a rundown on how 2000 through 2024 vehicles are holding up in 20
potential trouble spots, ranging from the engine, transmission, electric motor, EV charging, and
brakes to power equipment and the electrical accessories.
NA indicates that we did not receive a large enough sample size to provide
data for a specific year. An X indicates that the vehicle was not manufactured for a specific year.